Your cart is currently empty!
Research Reports
US Political Campaign Media Spending 2010
Description
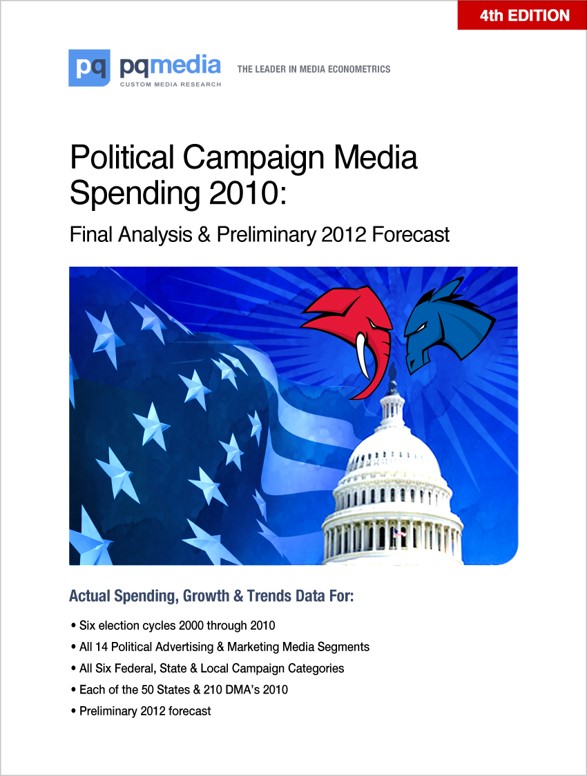
Political Campaign Media Spending 2010:
Final Analysis & Preliminary 2012 Forecast
The political candidate’s campaign objective never changes: Just win.
After contributions, the most important word in a political campaign is strategy. Armies of consultants are already gearing up for the 2012 election cycle. They’re primary objective is to keep their candidates “on strategy” and advising them if changes are needed. Remember the famous strategic campaign advice: “It’s the economy, stupid?”
The 4th edition of the PQ Media Campaign Media Spending series is a must-read and trusted resource for political and media consultants looking to develop winning campaign media strategies for candidates at the federal, state and local level.
Before the media pros can rally their candidate’s base, they first need a winning strategy to target and reach their constituents with an engaging message at the right time through the most effective medium. In today’s hyper-contentious political environment simply spending larger sums of money on TV alone no longer guarantees victory. For proof of this you need only look at the 2010 House and Senate race results. Often it was the more integrated media strategy and strong execution that made the difference between victory and defeat.
PQ Media Political Campaign Media Spending 2010 is packed with the most comprehensive and in-depth actionable strategic intelligence on political media spending, growth, shares and trends available anywhere. For the first time we’ve included supplemental data with comprehensive Excel spreadsheets and cross-tabs for every election cycle from 2000 to 2010, so you have all the data at your finger tips in one convenient place.
What’s covered in the report:
- Spending comparisons for all six election cycles from 2000 to 2010
- All 14 political advertising & marketing media segments
- Each of the six federal, state & local campaign categories
- 7 exclusive tables and charts
- 21 pages of in-depth analysis
What’s included in the supplemental Excel spreadsheets & cross-tabs:
Spending, growth and share by:
- Advertising medium – broadcast TV, cable TV, radio, newspaper, out-of-home, internet, mobile and magazines.
- Marketing medium – direct mail, telemarketing, public relations, event marketing, promotions and marketing research.
- Campaign category: President, House, Senate, Governor, local/regional races and issues/referendums
- Also included is spending by in all 50 states & 210 DMA’s for 2010
The report and supplemental tables make it easy for you to:
- Select one of six federal, state & local campaign race categories for analysis;
- Quickly benchmark your campaign against presidential and non-presidential years;
- Spot clear trends with accurate historical share of media spend by race;
- Identify media for greater campaign investment and media to avoid;
- Import presentation-ready supplemental Excel tables into your proposals
